82 LV= Annual Report 2012
Notes to the Financial Statements continued
31 December 2012
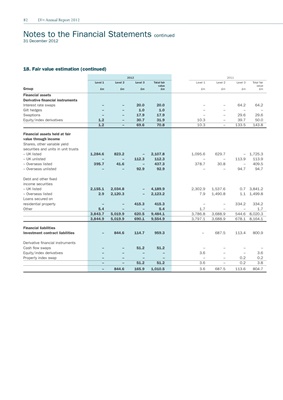
18. Fair value estimation (continued)
2012 2011
Level 1 Level 2 Level 3 Total fair Level 1 Level 2 Level 3 Total fair
value value
Group £m £m £m £m £m £m £m £m
Financial assets
Derivative financial instruments
Interest rate swaps – – 20.0 20.0 – – 64.2 64.2
Gilt hedges – – 1.0 1.0 – – – –
Swaptions – – 17.9 17.9 – – 29.6 29.6
Equity/index derivatives 1.2 – 30.7 31.9 10.3 – 39.7 50.0
1.2 – 69.6 70.8 10.3 – 133.5 143.8
Financial assets held at fair
value through income
Shares, other variable yield
securities and units in unit trusts
– UK listed 1,284.6 823.2 – 2,107.8 1,095.6 629.7 – 1,725.3
– UK unlisted – – 112.3 112.3 – – 113.9 113.9
– Overseas listed 395.7 41.6 – 437.3 378.7 30.8 – 409.5
– Overseas unlisted – – 92.9 92.9 – – 94.7 94.7
Debt and other fixed
income securities
– UK listed 2,155.1 2,034.8 – 4,189.9 2,302.9 1,537.6 0.7 3,841.2
– Overseas listed 2.9 2,120.3 – 2,123.2 7.9 1,490.8 1.1 1,499.8
Loans secured on
residential property – – 415.3 415.3 – – 334.2 334.2
Other 5.4 – – 5.4 1.7 – – 1.7
3,843.7 5,019.9 620.5 9,484.1 3,786.8 3,688.9 544.6 8,020.3
3,844.9 5,019.9 690.1 9,554.9 3,797.1 3,688.9 678.1 8,164.1
Financial liabilities
Investment contract liabilities – 844.6 114.7 959.3 – 687.5 113.4 800.9
Derivative financial instruments
Cash flow swaps – – 51.2 51.2 – – – –
Equity/index derivatives – – – – 3.6 – – 3.6
Property index swap – – – – – – 0.2 0.2
– – 51.2 51.2 3.6 – 0.2 3.8
– 844.6 165.9 1,010.5 3.6 687.5 113.6 804.7