Our Accounts 83
Notes to the Financial Statements continued
31 December 2012
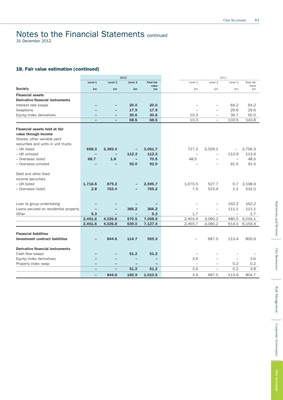
18. Fair value estimation (continued)
2012 2011
Level 1 Level 2 Level 3 Total fair Level 1 Level 2 Level 3 Total fair
value value
Society £m £m £m £m £m £m £m £m
Financial assets
Derivative financial instruments
Interest rate swaps – – 20.0 20.0 – – 64.2 64.2
Swaptions – – 17.9 17.9 – – 29.6 29.6
Equity/index derivatives – – 30.6 30.6 10.3 – 39.7 50.0
– – 68.5 68.5 10.3 – 133.5 143.8
Financial assets held at fair
value through income
Shares, other variable yield
securities and units in unit trusts
– UK listed 668.3 2,383.4 – 3,051.7 727.2 2,029.1 – 2,756.3
– UK unlisted – – 112.3 112.3 – – 113.9 113.9
– Overseas listed 68.7 1.8 – 70.5 48.5 – – 48.5
– Overseas unlisted – – 92.0 92.0 – – 91.5 91.5
Debt and other fixed
income securities
– UK listed 1,716.5 879.2 – 2,595.7 1,670.5 527.7 0.7 2,198.9
– Overseas listed 2.8 762.4 – 765.2 7.5 523.4 1.1 532.0
Statements and Reviews
Loan to group undertaking – – – – – – 162.2 162.2
Loans secured on residential property – – 366.2 366.2 – – 111.1 111.1
Other 5.3 – – 5.3 1.7 – – 1.7
2,461.6 4,026.8 570.5 7,058.9 2,455.4 3,080.2 480.5 6,016.1
2,461.6 4,026.8 639.0 7,127.4 2,465.7 3,080.2 614.0 6,159.9
Financial liabilities
Investment contract liabilities – 844.6 114.7 959.3 – 687.5 113.4 800.9
Derivative financial instruments
Our Businesses
Cash flow swaps – – 51.2 51.2 – – – –
Equity/index derivatives – – – – 3.6 – – 3.6
Property index swap – – – – – – 0.2 0.2
– – 51.2 51.2 3.6 – 0.2 3.8
– 844.6 165.9 1,010.5 3.6 687.5 113.6 804.7 Risk Management
Corporate Governance
Our Accounts