66 LV= Annual Report 2012
Notes to the Financial Statements continued
31 December 2012
3. Risk management and control (continued)
The Ogden discount rate is set by the Lord Chancellor. It is currently 2.5% but a revision is under consideration with a decision possible
by late 2013. Whilst there are many views across the industry in terms of what the change should be, the general consensus is that a
reduction in the rate is likely. The claims provision has included an allowance for a change in the Ogden discount rate, using a scenario
based approach as for PPOs. The allowance is broadly equivalent to a reduction in the discount rate to 1.75%. If the discount rate was to
reduce to 1.5%, the claims provision would deteriorate by £4.4m. A reduction to 1% would lead to a deterioration of £14.3m.
The claims provision is also sensitive to the number and cost of large motor claims (defined as greater than £1m), which have been
incurred but not reported and reserved. We would typically expect a number of large claims from expired risks to be identified in the
future, either from being newly reported or from existing claims increasing in magnitude above the £1m threshold. The claims provision
allows for £23.7m of late reported/reserved large claims. Therefore, if six new claims at £5m each were reported, for example, this would
lead to a £6.3m deterioration in the reserves, whereas four new £5m claims would lead to a £3.7m improvement.
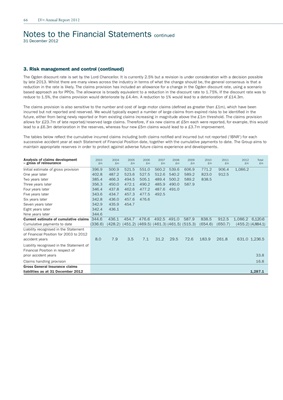
The tables below reflect the cumulative incurred claims including both claims notified and incurred but not reported (‘IBNR’) for each
successive accident year at each Statement of Financial Position date, together with the cumulative payments to date. The Group aims to
maintain appropriate reserves in order to protect against adverse future claims experience and developments.
Analysis of claims development 2003 2004 2005 2006 2007 2008 2009 2010 2011 2012 Total
– gross of reinsurance £m £m £m £m £m £m £m £m £m £m £m
Initial estimate of gross provision 396.9 500.9 521.5 551.0 560.2 539.6 606.9 771.2 906.4 1,086.2
One year later 402.8 487.2 523.6 527.5 512.6 540.2 589.2 823.0 912.5
Two years later 385.4 466.3 494.5 505.1 489.4 500.2 589.2 838.5
Three years later 356.3 450.0 472.1 490.2 485.9 490.0 587.9
Four years later 346.4 437.8 462.6 477.2 487.6 491.0
Five years later 343.6 434.7 457.3 477.5 492.5
Six years later 342.8 436.0 457.6 476.6
Seven years later 342.9 435.9 454.7
Eight years later 342.4 436.1
Nine years later 344.6
Current estimate of cumulative claims 344.6 436.1 454.7 476.6 492.5 491.0 587.9 838.5 912.5 1,086.2 6,120.6
Cumulative payments to date (336.6) (428.2) (451.2) (469.5) (461.3) (461.5) (515.3) (654.6) (650.7) (455.2) (4,884.1)
Liability recognised in the Statement
of Financial Position for 2003 to 2012
accident years 8.0 7.9 3.5 7.1 31.2 29.5 72.6 183.9 261.8 631.0 1,236.5
Liability recognised in the Statement of
Financial Position in respect of
prior accident years 33.8
Claims handling provision 16.8
Gross General Insurance claims
liabilities as at 31 December 2012 1,287.1