Notes to the Group Financial Statements (continued)
for the year ended 31st December 2012
29. Financial instruments – risk management (continued)
of £35.5m (2011: profit of £31.1m). The business is cash generative with a low capital expenditure requirement. The Group remains committed to its
stated dividend policy of 30% to 40% of Underlying Operating Profit after interest and tax. In addition, the Group’s other main priority is to generate
cash to support its operations and to fund any strategic acquisitions.
2012 2011
£’000 £’000
Interest bearing loans and borrowings (including loan notes and overdraft) 44,561 49,028
Less: 2% and 12% unsecured loan notes (8,660) (10,156)
Less: other loan notes – (750)
Less: cash and short term deposit (225) (435)
Less: deferred and contingent consideration (9,028) (1,939)
Net Bank Debt (excluding loan notes) 26,648 35,748
Credit risk
There are no significant concentrations of credit risk within the Group. The Group is exposed to a credit risk in respect of revenue transactions (i.e.
turnover from customers). It is Group policy, implemented locally, to obtain appropriate details of new customers before entering into contracts.
The majority of the estate agency customers use the Group’s services as part of a house sale transaction and consequently the debt is paid from the
proceeds realised from the sale of the house by the vendor’s solicitor before the balance of funds is transferred to the vendor. These minimise the
risk of the debt not being collected.
The majority of the surveying customers and those of the asset management business are large financial institutions and as such the credit risk is not
expected to be significant. The maximum credit risk exposure relating to financial assets is represented by the carrying value as at the balance sheet
date.
Interest rate risk profile of financial assets and liabilities
Treasury policy is described in the note above. The disclosures below exclude short term receivables and payables which are primarily of a trading
nature and expected to be settled within normal commercial terms.
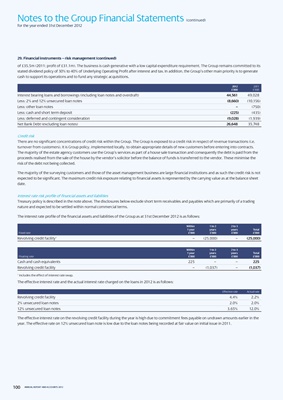
The interest rate profile of the financial assets and liabilities of the Group as at 31st December 2012 is as follows:
Within 1 to 2 2 to 3
1 year years years total
Fixed rate £’000 £’000 £’000 £’000
Revolving credit facility1 – (25,000) – (25,000)
Within 1 to 2 2 to 3
1 year years years total
Floating rate £’000 £’000 £’000 £’000
Cash and cash equivalents 225 – – 225
Revolving credit facility – (1,037) – (1,037)
1
Includes the effect of interest rate swap.
The effective interest rate and the actual interest rate charged on the loans in 2012 is as follows:
Effective rate Actual rate
Revolving credit facility 4.4% 2.2%
2% unsecured loan notes 2.0% 2.0%
12% unsecured loan notes 3.65% 12.0%
The effective interest rate on the revolving credit facility during the year is high due to commitment fees payable on undrawn amounts earlier in the
year. The effective rate on 12% unsecured loan note is low due to the loan notes being recorded at fair value on initial issue in 2011.
100 ANNUAL REPORT AND ACCOUNTS 2012