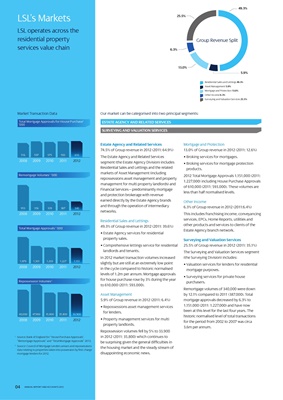
49.3%
LSL’s Markets 25.5%
LSL operates across the
residential property Group Revenue Split
services value chain 6.3%
13.0%
5.9%
Residential Sales and Lettings 49.3%
Asset Management 5.9%
Mortgage and Protection 13.0%
Other Income 6.3%
Surveying and Valuation Services 25.5%
Market Transaction Data Our market can be categorised into two principal segments:
Total Mortgage Approvals for House Purchase 1
EStAtE AgEncy AnD RELAtED SERVicES
‘000
SuRVEying AnD VALuAtion SERVicES
Estate Agency and Related Services Mortgage and Protection
74.5% of Group revenue in 2012 (2011: 64.9%) 13.0% of Group revenue in 2012 (2011: 12.6%)
516 597 575 593 610
The Estate Agency and Related Services • Broking services for mortgages.
2008 2009 2010 2011 2012 segment (the Estate Agency Division) includes • Broking services for mortgage protection
Residential Sales and Lettings and the related products.
Remortgage Volumes1 ‘000
markets of Asset Management (including
2012 Total Mortgage Approvals 1,151,000 (2011:
repossessions asset management and property
1,227,000) including House Purchase Approvals
management for multi property landlords) and
of 610,000 (2011: 593,000). These volumes are
Financial Services – predominantly mortgage
less than half normalised levels.
and protection brokerage with revenue
earned directly by the Estate Agency brands Other Income
953 356 339 387 340
and through the operation of intermediary 6.3% of Group revenue in 2012 (2011:6.4%)
networks.
2008 2009 2010 2011 2012 This includes franchising income, conveyancing
Residential Sales and Lettings services, EPCs, Home Reports, utilities and
49.3% of Group revenue in 2012 (2011: 39.6%) other products and services to clients of the
Total Mortgage Approvals1 ‘000
Estate Agency branch network.
• Estate Agency services for residential
property sales. Surveying and Valuation Services
• Comprehensive lettings service for residential 25.5% of Group revenue in 2012 (2011: 35.1%)
landlords and tenants. The Surveying and Valuation Services segment
In 2012 market transaction volumes increased (the Surveying Division) includes:
1,979 1,301 1,203 1,227 1,151
slightly but are still at an extremely low point • Valuation services for lenders for residential
2008 2009 2010 2011 2012 in the cycle compared to historic normalised mortgage purposes.
levels of 1.2m per annum. Mortgage approvals
• Surveying services for private house
Repossession Volumes2 for house purchase rose by 3% during the year
purchasers.
to 610,000 (2011: 593,000).
Remortgage volumes of 340,000 were down
Asset Management by 12.1% compared to 2011 (387,000). Total
5.9% of Group revenue in 2012 (2011: 6.4%) mortgage approvals decreased by 6.3% to
• Repossessions asset management services 1,151,000 (2011: 1,227,000) and have now
for lenders. been at this level for the last four years. The
40,000 47,900 35,800 35,800 33,900
historic normalised level of total transactions
2008 2009 2010 2011 2012 • Property management services for multi
for the period from 2002 to 2007 was circa
property landlords.
3.6m per annum.
Repossession volumes fell by 5% to 33,900
1
Source: Bank of England for “House Purchase Approvals”, in 2012 (2011: 35,800) which continues to
“Remortgage Approvals” and “Total Mortgage Approvals” 2013.
be surprising given the general difficulties in
2.
Source: Council of Mortgage Lenders arrears and repossessions
data relating to properties taken into possession by first-charge
the housing market and the steady stream of
mortgage lenders for 2012. disappointing economic news.
04 ANNUAL REPORT AND ACCOUNTS 2012