Overview
Directors’ Report and Business Review
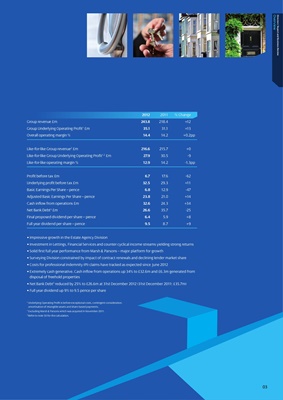
2012 2011 % Change
Group revenue £m 243.8 218.4 +12
Group Underlying Operating Profit £m 1
35.1 31.1 +13
Overall operating margin % 14.4 14.2 +0.2pp
Like-for-like Group revenue2 £m 216.6 215.7 +0
Like-for-like Group Underlying Operating Profit1,2 £m 27.9 30.5 -9
Like-for-like operating margin % 12.9 14.2 -1.3pp
Profit before tax £m 6.7 17.6 -62
Underlying profit before tax £m 32.5 29.3 +11
Basic Earnings Per Share – pence 6.8 12.9 -47
Adjusted Basic Earnings Per Share – pence 23.8 21.0 +14
Cash inflow from operations £m 32.6 24.3 +34
Net Bank Debt3 £m 26.6 35.7 -25
Final proposed dividend per share – pence 6.4 5.9 +8
Full year dividend per share – pence 9.5 8.7 +9
• Impressive growth in the Estate Agency Division
• Investment in Lettings, Financial Services and counter cyclical income streams yielding strong returns
• Solid first full year performance from Marsh & Parsons – major platform for growth
• Surveying Division constrained by impact of contract renewals and declining lender market share
• Costs for professional indemnity (PI) claims have tracked as expected since June 2012
• Extremely cash generative. Cash inflow from operations up 34% to £32.6m and £6.3m generated from
disposal of freehold properties
• Net Bank Debt3 reduced by 25% to £26.6m at 31st December 2012 (31st December 2011: £35.7m)
• Full year dividend up 9% to 9.5 pence per share
1
Underlying Operating Profit is before exceptional costs, contingent consideration.
amortisation of intangible assets and share-based payments.
2
Excluding Marsh & Parsons which was acquired in November 2011.
3
Refer to note 30 for the calculation.
03