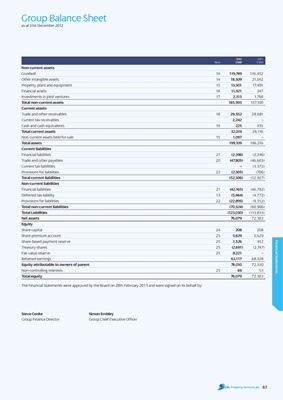
Group Balance Sheet
as at 31st December 2012
2012 2011
Note £’000 £’000
non-current assets
Goodwill 14 119,749 116,452
Other intangible assets 14 18,509 21,042
Property, plant and equipment 15 13,501 17,491
Financial assets 16 11,921 347
Investments in joint ventures 17 2,313 1,768
total non-current assets 165,993 157,100
current assets
Trade and other receivables 18 29,552 28,681
Current tax receivables 2,242 –
Cash and cash equivalents 19 225 435
total current assets 32,019 29,116
Non-current assets held for sale 15 1,097 –
total assets 199,109 186,216
current liabilities
Financial liabilities 21 (2,396) (2,246)
Trade and other payables 20 (47,805) (46,603)
Current tax liabilities – (3,372)
Provisions for liabilities 22 (2,305) (706)
total current liabilities (52,506) (52,927)
non-current liabilities
Financial liabilities 21 (42,165) (46,782)
Deferred tax liability 13 (5,464) (4,772)
Provisions for liabilities 22 (22,895) (9,352)
total non-current liabilities (70,524) (60,906)
total Liabilities (123,030) (113,833)
net assets 76,079 72,383
Equity
Share capital 24 208 208
Share premium account 25 5,629 5,629
Share-based payment reserve 25 1,526 912
Financial Statements
Treasury shares 25 (2,691) (2,747)
Fair value reserve 25 8,221 –
Retained earnings 63,117 68,328
Equity attributable to owners of parent 76,010 72,330
Non-controlling interests 25 69 53
total equity 76,079 72,383
The Financial Statements were approved by the Board on 28th February 2013 and were signed on its behalf by:
Steve cooke Simon Embley
Group Finance Director Group Chief Executive Officer
61