below, is measured differently from operating profit or loss in the Group Financial Statements. Head office costs, Group financing (including finance
costs and finance incomes) and income taxes are managed on a Group basis and are not allocated to operating segments.
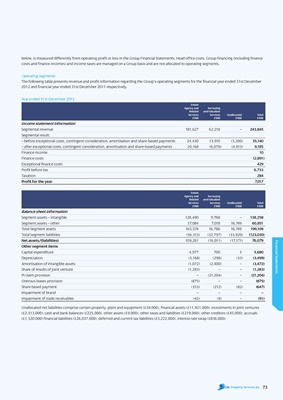
Operating segments
The following table presents revenue and profit information regarding the Group’s operating segments for the financial year ended 31st December
2012 and financial year ended 31st December 2011 respectively.
Year ended 31st December 2012
Estate
Agency and Surveying
Related and Valuation
Services Services unallocated total
£’000 £’000 £’000 £’000
income statement information
Segmental revenue 181,627 62,218 – 243,845
Segmental result:
– before exceptional costs, contingent consideration, amortisation and share-based payments 24,430 13,910 (3,200) 35,140
– after exceptional costs, contingent consideration, amortisation and share-based payments 20,168 (6,070) (4,913) 9,185
Finance income 10
Finance costs (2,891)
Exceptional finance costs 429
Profit before tax 6,733
Taxation 284
Profit for the year 7,017
Estate
Agency and Surveying
Related and Valuation
Services Services unallocated total
£’000 £’000 £’000 £’000
Balance sheet information
Segment assets – intangible 128,490 9,768 – 138,258
Segment assets – other 37,084 7,018 16,749 60,851
Total Segment assets 165,574 16,786 16,749 199,109
Total Segment liabilities (56,313) (32,797) (33,920) (123,030)
net assets/(liabilities) 109,261 (16,011) (17,171) 76,079
Financial Statements
other segment items
Capital expenditure 4,977 700 3 5,680
Depreciation (3,168) (298) (33) (3,499)
Amortisation of intangible assets (1,072) (2,400) – (3,472)
Share of results of joint venture (1,283) – – (1,283)
PI claim provision – (21,204) – (21,204)
Onerous leases provision (875) – – (875)
Share based payment (353) (212) (82) (647)
Impairment of brand – – – –
Impairment of trade receivables (42) (9) – (51)
Unallocated net liabilities comprise certain property, plant and equipment (£39,000), financial assets (£11,921,000), investments in joint ventures
(£2,313,000), cash and bank balances (£225,000), other assets (£9,000), other taxes and liabilities (£219,000), other creditors (£45,000), accruals
(£1,320,000) financial liabilities (£26,037,000), deferred and current tax liabilities (£3,222,000), interest rate swap (£836,000).
73