Notes to the Group Financial Statements (continued)
for the year ended 31st December 2012
7. Exceptional items and contingent consideration (continued)
contingent consideration
The acquisition of Marsh & Parsons in November 2011 has resulted in an exceptional contingent consideration expense of £1.8m (2011: £0.1m) in
the current year. Assuming the level of profits and new branch openings remain on forecast, this charge is expected to continue at this level until
31st December 2015. The acquisitions of Davis Tate and Lauristons in the current year resulted in an exceptional expense of £2.3m (2011: £nil),
but the impact of these acquisitions on future years will be far smaller unless there are significant changes in the forecast profitability of these
acquisitions. See notes 21 and 27 to these Financial Statements for more details.
8. Profit before tax
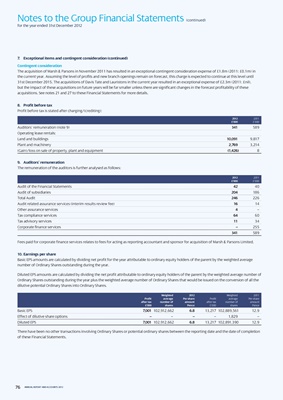
Profit before tax is stated after charging/(crediting):
2012 2011
£’000 £’000
Auditors’ remuneration (note 9) 341 589
Operating lease rentals:
Land and buildings 10,091 9,817
Plant and machinery 2,769 3,214
(Gain)/loss on sale of property, plant and equipment (1,426) 8
9. Auditors’ remuneration
The remuneration of the auditors is further analysed as follows:
2012 2011
£’000 £’000
Audit of the Financial Statements 42 40
Audit of subsidiaries 204 186
Total Audit 246 226
Audit related assurance services (interim results review fee) 16 14
Other assurance services 4 –
Tax compliance services 64 60
Tax advisory services 11 34
Corporate finance services – 255
341 589
Fees paid for corporate finance services relates to fees for acting as reporting accountant and sponsor for acquisition of Marsh & Parsons Limited.
10. Earnings per share
Basic EPS amounts are calculated by dividing net profit for the year attributable to ordinary equity holders of the parent by the weighted average
number of Ordinary Shares outstanding during the year.
Diluted EPS amounts are calculated by dividing the net profit attributable to ordinary equity holders of the parent by the weighted average number of
Ordinary Shares outstanding during the year plus the weighted average number of Ordinary Shares that would be issued on the conversion of all the
dilutive potential Ordinary Shares into Ordinary Shares.
Weighted 2012 Weighted 2011
Profit average Per share Profit average Per share
after tax number of amount after tax number of amount
£’000 shares Pence £’000 shares Pence
Basic EPS 7,001 102,912,662 6.8 13,217 102,889,561 12.9
Effect of dilutive share options – – – – 1,829 –
Diluted EPS 7,001 102,912,662 6.8 13,217 102,891,390 12.9
There have been no other transactions involving Ordinary Shares or potential ordinary shares between the reporting date and the date of completion
of these Financial Statements.
76 ANNUAL REPORT AND ACCOUNTS 2012