2012 2011
£’000 £’000
Share of the joint ventures’ results:
Revenue 20,520 13,857
Operating expenses (18,968) (12,936)
operating profit 1,552 921
Finance income 16 12
Finance costs (6) (3)
Profit before tax 1,562 930
Taxation (279) (251)
Profit after tax 1,283 679
18. trade and other receivables
2012 2011
£’000 £’000
current
Trade receivables 20,966 20,492
Prepayments and accrued income 8,586 8,189
29,552 28,681
Trade receivables are non interest bearing and are generally on 0-30 day terms.
As at 31st December 2012, trade receivables with a nominal value of £1,233,000 (2011: £1,394,000) were impaired and fully provided for.
Movements in the provision for impairment of receivables were as follows:
2012 2011
£’000 £’000
At 1st January 1,394 533
Acquisitions during the year – 403
Charge for the year 52 666
Amounts written off (213) (208)
At 31st December 1,233 1,394
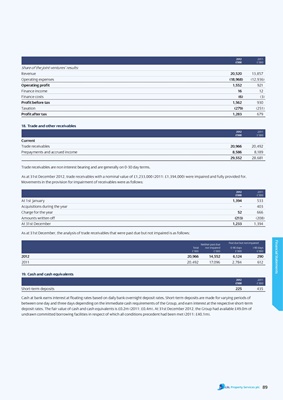
As at 31st December, the analysis of trade receivables that were past due but not impaired is as follows:
Financial Statements
Past due but not impaired
Neither past due
Total nor impaired 0-90 days >90 days
£’000 £’000 £’000 £’000
2012 20,966 14,552 6,124 290
2011 20,492 17,096 2,784 612
19. cash and cash equivalents
2012 2011
£’000 £’000
Short-term deposits 225 435
Cash at bank earns interest at floating rates based on daily bank overnight deposit rates. Short-term deposits are made for varying periods of
between one day and three days depending on the immediate cash requirements of the Group, and earn interest at the respective short-term
deposit rates. The fair value of cash and cash equivalents is £0.2m (2011: £0.4m). At 31st December 2012, the Group had available £49.0m of
undrawn committed borrowing facilities in respect of which all conditions precedent had been met (2011: £40.1m).
89