13
City of Glasgow College Annual Report & Accounts 2019-20
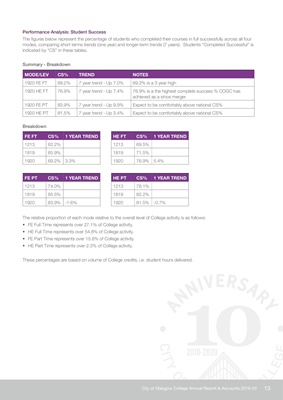
Performance Analysis: Student Success
The figures below represent the percentage of students who completed their courses in full successfully across all four
modes, comparing short terms trends (one year) and longer-term trends (7 years). Students "Completed Successful" is
indicated by "CS" in these tables.
Summary - Breakdown
MODE/LEV CS% TREND NOTES
1920 FE FT 69.2% 7 year trend - Up 7.0% 69.2% is a 3 year high
1920 HE FT 76.9% 7 year trend - Up 7.4% 76.9% is a the highest complete success % COGC has
achieved as a since merger
1920 FE PT 83.9% 7 year trend - Up 9.9% Expect to be comfortably above national CS%
1920 HE PT 81.5% 7 year trend - Up 3.4% Expect to be comfortably above national CS%
Breakdown
FE FT CS% 1 YEAR TREND
1213 62.2%
1819 65.9%
1920 69.2% 3.3%
HE FT CS% 1 YEAR TREND
1213 69.5%
1819 71.5%
1920 76.9% 5.4%
FE PT CS% 1 YEAR TREND
1213 74.0%
1819 85.5%
1920 83.9% -1.6%
HE PT CS% 1 YEAR TREND
1213 78.1%
1819 82.2%
1920 81.5% -0.7%
The relative proportion of each mode relative to the overall level of College activity is as follows:
• FE Full Time represents over 27.1% of College activity.
• HE Full Time represents over 54.8% of College activity.
• FE Part Time represents over 15.8% of College activity.
• HE Part Time represents over 2.3% of College activity.
These percentages are based on volume of College credits, i.e. student hours delivered.