85
City of Glasgow College Annual Report & Accounts 2019-20
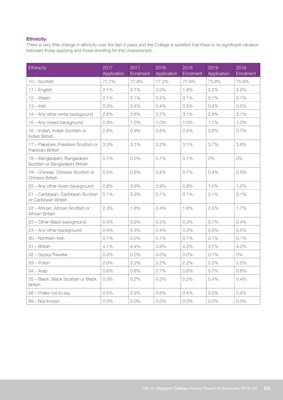
Ethnicity
There is very little change in ethnicity over the last 3 years and the College is satisfied that there is no significant variation
between those applying and those enrolling for this characteristic.
Ethiinicity 2017
Application
2017
Enrolment
2018
Application
2018
Enrolment
2019
Application
2019
Enrolment
10 - Scottish 77.7% 77.8% 77.2% 77.8% 75.8% 75.9%
11 - English 2.1% 2.1% 2.0% 1.8% 2.2% 2.2%
12 - Welsh 0.1% 0.1% 0.2% 0.1% 0.1% 0.1%
13 - Irish 0.3% 0.4% 0.4% 0.5% 0.4% 0.5%
14 - Any other white background 2.6% 2.6% 2.7% 3.1% 2.9% 3.1%
15 - Any mixed background 0.9% 1.0% 1.0% 1.0% 1.1% 1.2%
16 - Indian, Indian Scottish or
Indian British
0.8% 0.9% 0.6% 0.4% 0.8% 0.7%
17 - Pakistani, Pakistani Scottish or
Pakistani British
3.3% 3.1% 3.2% 3.1% 3.7% 3.8%
18 - Bangladeshi, Bangladeshi
Scottish or Bangladeshi British
0.1% 0.0% 0.1% 0.1% 0% 0%
19 - Chinese, Chinese Scottish or
Chinese British
0.5% 0.6% 0.5% 0.7% 0.4% 0.5%
20 - Any other Asian background 0.8% 0.9% 0.9% 0.9% 1.0% 1.0%
21 - Caribbean, Caribbean Scottish
or Caribbean British
0.1% 0.2% 0.1% 0.1% 0.1% 0.1%
22 - African, African Scottish or
African British
2.3% 1.8% 2.4% 1.8% 2.5% 1.7%
23 - Other Black background 0.4% 0.2% 0.5% 0.3% 0.7% 0.4%
24 - Any other background 0.4% 0.3% 0.4% 0.3% 0.6% 0.5%
30 - Northern Irish 0.1% 0.0% 0.1% 0.1% 0.1% 0.1%
31 - British 4.1% 4.4% 3.9% 4.3% 3.7% 4.0%
32 - Gypsy/Traveller 0.0% 0.0% 0.0% 0.0% 0.1% 0%
33 - Polish 2.0% 2.3% 2.2% 2.2% 2.2% 2.5%
34 - Arab 0.6% 0.6% 0.7% 0.6% 0.7% 0.8%
35 - Black, Black Scottish or Black
British
0.3% 0.2% 0.3% 0.2% 0.4% 0.4%
98 - Prefer not to say 0.5% 0.3% 0.6% 0.4% 0.5% 0.4%
99 - Not known 0.0% 0.0% 0.0% 0.0% 0.0% 0.0%