Colleagues1
Portrait in numbers
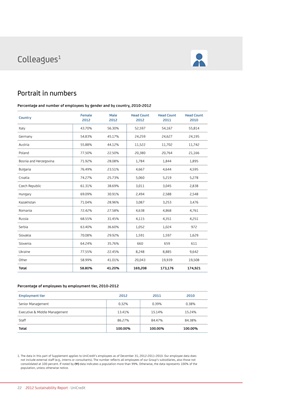
Percentage and number of employees by gender and by country, 2010-2012
Female Male Head Count Head Count Head Count
Country
2012 2012 2012 2011 2010
Italy 43.70% 56.30% 52,597 54,167 55,814
Germany 54.83% 45.17% 24,259 24,627 24,195
Austria 55.88% 44.12% 11,522 11,702 11,742
Poland 77.50% 22.50% 20,380 20,764 21,166
Bosnia and Herzegovina 71.92% 28.08% 1,784 1,844 1,895
Bulgaria 76.49% 23.51% 4,667 4,644 4,595
Croatia 74.27% 25.73% 5,060 5,219 5,278
Czech Republic 61.31% 38.69% 3,011 3,045 2,838
Hungary 69.09% 30.91% 2,494 2,588 2,548
Kazakhstan 71.04% 28.96% 3,087 3,253 3,476
Romania 72.42% 27.58% 4,638 4,868 4,761
Russia 68.55% 31.45% 4,115 4,351 4,251
Serbia 63.40% 36.60% 1,052 1,024 972
Slovakia 70.08% 29.92% 1,591 1,597 1,629
Slovenia 64.24% 35.76% 660 659 611
Ukraine 77.55% 22.45% 8,248 8,885 9,642
Other 58.99% 41.01% 20,043 19,939 19,508
Total 58.80% 41.20% 169,208 173,176 174,921
Percentage of employees by employment tier, 2010-2012
Employment tier 2012 2011 2010
Senior Management 0.32% 0.39% 0.38%
Executive & Middle Management 13.41% 15.14% 15.24%
Staff 86.27% 84.47% 84.38%
Total 100.00% 100.00% 100.00%
1. The data in this part of Supplement applies to UniCredit’s employees as of December 31, 2012-2011-2010. Our employee data does
not include external staff (e.g., interns or consultants). The number reflects all employees of our Group’s subsidiaries, also those not
consolidated at 100 percent. If noted by (✾) data indicates a population more than 99%. Otherwise, the data represents 100% of the
population, unless otherwise notice.
22 2012 Sustainability Report · UniCredit