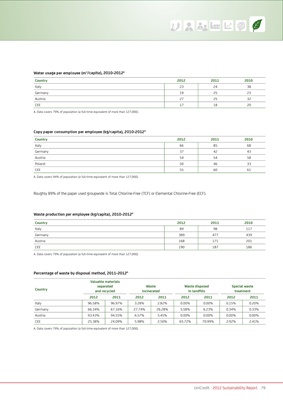
Water usage per employee (m3/capita), 2010-2012A
Country 2012 2011 2010
Italy 23 24 38
Germany 19 25 23
Austria 27 25 32
CEE 17 18 20
A. Data covers 79% of population (a full-time equivalent of more than 127,000).
Copy paper consumption per employee (kg/capita), 2010-2012A
Country 2012 2011 2010
Italy 66 85 68
Germany 37 42 43
Austria 54 54 58
Poland 50 46 33
CEE 55 60 61
A. Data covers 94% of population (a full-time equivalent of more than 127,000).
Roughly 89% of the paper used groupwide is Total Chlorine-Free (TCF) or Elemental Chlorine-Free (ECF).
Waste production per employee (kg/capita), 2010-2012A
Country 2012 2011 2010
Italy 89 98 117
Germany 389 477 439
Austria 168 171 201
CEE 190 187 186
A. Data covers 79% of population (a full-time equivalent of more than 127,000).
Percentage of waste by disposal method, 2011-2012A
Valuable materials
separated Waste Waste disposed Special waste
Country and recycled incinerated In landfills treatment
2012 2011 2012 2011 2012 2011 2012 2011
Italy 96.58% 96.97% 3.28% 2.82% 0.00% 0.00% 0.15% 0.20%
Germany 66.34% 67.16% 27.74% 26.28% 5.58% 6.23% 0.34% 0.33%
Austria 93.43% 94.55% 6.57% 5.45% 0.00% 0.00% 0.00% 0.00%
CEE 25.38% 24.09% 5.98% 2.50% 65.72% 70.99% 2.92% 2.41%
A. Data covers 79% of population (a full-time equivalent of more than 127,000).
UniCredit · 2012 Sustainability Report 79