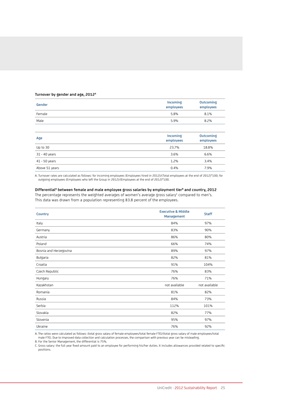
Turnover by gender and age, 2012A
Incoming Outcoming
Gender
employees employees
Female 5.8% 8.1%
Male 5.9% 8.2%
Incoming Outcoming
Age
employees employees
Up to 30 23.7% 18.8%
31 - 40 years 3.6% 6.6%
41 - 50 years 1.2% 3.4%
Above 51 years 0.4% 7.9%
A. Turnover rates are calculated as follows: for incoming employees (Employees hired in 2012)/(Total employees at the end of 2012)*100; for
outgoing employees (Employees who left the Group in 2012)/(Employees at the end of 2012)*100.
DifferentialA between female and male employee gross salaries by employment tierB and country, 2012
The percentage represents the weighted averages of women’s average gross salaryC compared to men’s.
This data was drawn from a population representing 83.8 percent of the employees.
Executive & Middle
Country Staff
Management
Italy 84% 97%
Germany 83% 90%
Austria 86% 80%
Poland 66% 74%
Bosnia and Herzegovina 89% 97%
Bulgaria 82% 81%
Croatia 91% 104%
Czech Republic 76% 83%
Hungary 76% 71%
Kazakhstan not available not available
Romania 81% 82%
Russia 84% 73%
Serbia 112% 101%
Slovakia 82% 77%
Slovenia 95% 97%
Ukraine 76% 92%
A. The ratios were calculated as follows: (total gross salary of female employees/total female FTE)/(total gross salary of male employees/total
male FTE). Due to improved data collection and calculation processes, the comparison with previous year can be misleading.
B. For the Senior Management, the differential is 75%.
C. Gross salary: the full year fixed amount paid to an employee for performing his/her duties. It includes allowances provided related to specific
positions.
UniCredit · 2012 Sustainability Report 25