Preserving Natural Resources
Environmental performance indicators1
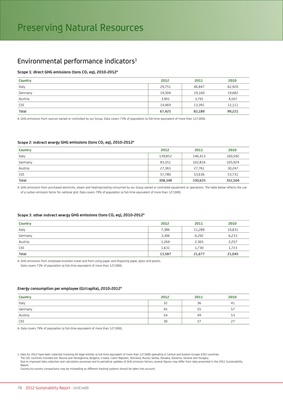
Scope 1: direct GHG emissions (tons CO2 eq), 2010-2012A
Country 2012 2011 2010
Italy 29,751 46,847 62,920
Germany 19,304 19,160 19,682
Austria 3,901 3,791 4,507
CEE 14,469 13,391 12,111
Total 67,425 83,189 99,221
A. GHG emissions from sources owned or controlled by our Group. Data covers 73% of population (a full-time equivalent of more than 127,000).
Scope 2: indirect energy GHG emissions (tons CO2 eq), 2010-2012A
Country 2012 2011 2010
Italy 139,852 146,413 160,592
Germany 83,351 102,816 105,924
Austria 27,365 27,761 30,247
CEE 57,780 53,636 53,731
Total 308,348 330,625 352,504
A. GHG emissions from purchased electricity, steam and heating/cooling consumed by our Group owned or controlled equipment or operations. The table below reflects the use
of a carbon emission factor for national grid. Data covers 79% of population (a full-time equivalent of more than 127,000).
Scope 3: other indirect energy GHG emissions (tons CO2 eq), 2010-2012A
Country 2012 2011 2010
Italy 7,386 11,289 10,831
Germany 3,306 6,292 6,233
Austria 1,264 2,365 2,257
CEE 1,631 1,730 1,723
Total 13,587 21,677 21,045
A. GHG emissions from employee business travel and from using paper and disposing paper, glass and plastic.
Data covers 73% of population (a full-time equivalent of more than 127,000).
Energy consumption per employee (GJ/capita), 2010-2012A
Country 2012 2011 2010
Italy 32 36 41
Germany 45 55 57
Austria 54 49 53
CEE 30 27 27
A. Data covers 79% of population (a full-time equivalent of more than 127,000).
1. Data for 2012 have been collected involving 64 legal entities (a full-time equivalent of more than 127,000) operating in Central and Eastern Europe (CEE) countries.
The CEE countries included are: Bosnia and Herzegovina, Bulgaria, Croatia, Czech Republic, Romania, Russia, Serbia, Slovakia, Slovenia, Ukraine and Hungary.
Due to improved data collection and calculation processes and to periodical updates of GHG emission factors, several figures may differ from data presented in the 2011 Sustainability
Report.
Country-to-country comparisons may be misleading as different tracking systems should be taken into account.
78 2012 Sustainability Report · UniCredit