Colleagues
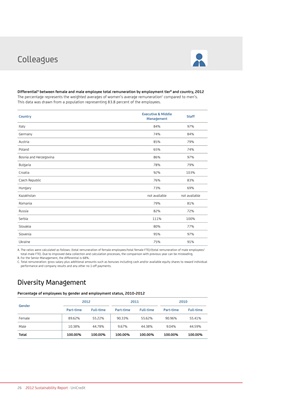
DifferentialA between female and male employee total remuneration by employment tierB and country, 2012
The percentage represents the weighted averages of women’s average remunerationC compared to men’s.
This data was drawn from a population representing 83.8 percent of the employees.
Executive & Middle
Country Staff
Management
Italy 84% 97%
Germany 74% 84%
Austria 85% 79%
Poland 65% 74%
Bosnia and Herzegovina 86% 97%
Bulgaria 78% 79%
Croatia 92% 103%
Czech Republic 76% 83%
Hungary 73% 69%
Kazakhstan not available not available
Romania 79% 81%
Russia 82% 72%
Serbia 111% 100%
Slovakia 80% 77%
Slovenia 95% 97%
Ukraine 75% 91%
A. The ratios were calculated as follows: (total remuneration of female employees/total female FTE)/(total remuneration of male employees/
total male FTE). Due to improved data collection and calculation processes, the comparison with previous year can be misleading.
B. For the Senior Management, the differential is 68%.
C. Total remuneration: gross salary plus additional amounts such as bonuses including cash and/or available equity shares to reward individual
performance and company results and any other no 1-off payments.
Diversity Management
Percentage of employees by gender and employment status, 2010-2012
2012 2011 2010
Gender
Part-time Full-time Part-time Full-time Part-time Full-time
Female 89.62% 55.22% 90.33% 55.62% 90.96% 55.41%
Male 10.38% 44.78% 9.67% 44.38% 9.04% 44.59%
Total 100.00% 100.00% 100.00% 100.00% 100.00% 100.00%
26 2012 Sustainability Report · UniCredit