0
5
10
15
20 1979
1980
1985
1990
1995
2000
2008
2010
Mortality rate (per 100,000 woman age- adjusted)
Year
Very high marginality
Cervical
Breast
Cervical (Oaxaca)
Breast (Oaxaca)
0
5
10
15
20 1979
1980
1985
1990
1995
2000
2005
2010
Mortality rate (per 100,000 woman age- adjusted)
Year
High marginality
!"
#"
$!"
$#"
%!" 1979
1980
1985
1990
1995
2000
2005
2010
Mortality rate (per 100,000 woman age- adjusted)
Year
Average marginality
Cervical
Breast
Cervical (Guanajuato)
Breast (Guanajuato)
Cervical
Breast
Cervical (Hidalgo)
Breast (Hidalgo)
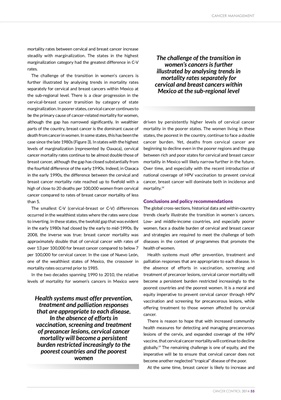
Figure 3: Trends in the mortality rate from cervical and breast cancer in Mexico by category of state marginality, 1979-2010
CANCER MANAGEMENT
56 CANCER CONTROL 2014