REGIONAL INITIATIVES
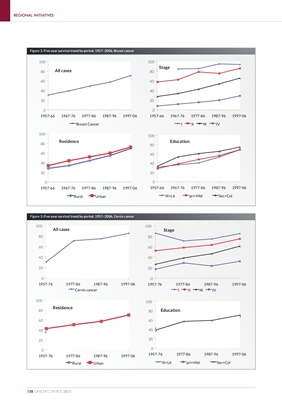
Fig 2: Five year survival trend by period, 1957-2006, Breast cancer
Figure 2: Five year survival trend by period, 1957–2006, Breast cancer
100 100
Stage
80 All cases 80
60 60
40 40
20 20
0 0
1957-66 1967-76 1977-86 1987-96 1997-06 1957-66 1967-76 1977-86 1987-96 1997-06
Breast Cancer I II III IV
100 100
80
Residence Education
80
60 60
40 40
20 20
0 0
1957-66 1967-76 1977-86 1987-96 1997-06 1957-66 1967-76 1977-86 1987-96 1997-06
Rural Urban iII+Lit pri+Mid Sec+Col
Figure 3: Five year survival trend by period, 1957–2006, Cervix cancer
100 100
All cases Stage
80 80
60 60
40 40
20 20
0 0
1957-76 1977-86 1987-96 1997-06 1957-76 1977-86 1987-96 1997-06
Cervix cancer I II III IV
100 100
Residence
80 80 Education
60 60
40 40
20 20
0 0
1957-76 1977-86 1987-96 1997-06 1957-76 1977-86 1987-96 1997-06
Rural Urban iII+Lit pri+Mid Sec+Col
128 CANCER CONTROL 2013