EPIDEMIOLOGY
survival represent large numbers of avoidable premature cancer patients who may be considered “cured” can still be
44,46
deaths . Even in the Nordic countries, where survival is high, estimated from the point when a curve of relative (or net)
some 5,300 (2.5%) of the deaths from 12 common cancers survival reaches a plateau. This indicates that, as a group, the
during 2008–2012 would have been avoidable by elimination cancer patients who have survived up to that time after
of regional variations in survival43. In Europe more widely, diagnosis no longer have significant excess mortality over that
disparities in five-year survival between the Nordic countries of the general population48-50.
and other European countries may have represented up to Estimates of “cure” have been made for patients with
150,000 avoidable premature deaths a year during 1995–99, cancers of the bowel, breast and cervix in Europe51. Similar
or 12% of the 1.3 million cancer deaths a year that happen approaches will be used to estimate the proportion of patients
47
within five years of diagnosis . who may be considered cured, and the mean survival time of
Estimation of the number of avoidable premature deaths patients who die before the point of cure is reached. It may be
among cancer patients in a wider range of populations will possible to estimate “cure” for cancers of the bowel and cervix,
contribute to the UICC World Cancer Declaration (goal #2) of and for childhood leukaemia52, but probably not for breast53,
improving measurement of the cancer burden, and of the lung or liver cancers. “Cure” estimates are not affected by
impact of cancer control interventions36. lead-time bias.
The proportion of patients who are “cured” Training and capacity development
Identifying individual cancer patients who may be considered The statistical methodology for cancer survival is undergoing
clinically cured is problematic. However, the proportion of all rapid development. The CONCORD programme contains a
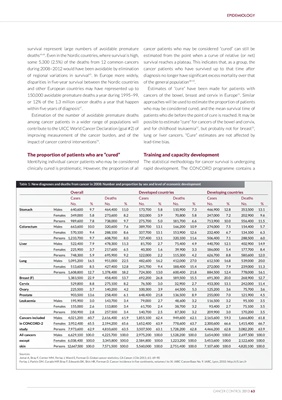
Table 1: New diagnoses and deaths from cancer in 2008: Number and proportion by sex and level of economic development
Overall Developed countries Developing countries
Cases Deaths Cases Deaths Cases Deaths
No. % No. % No. % No. % No. % No. %
Stomach Males 640,600 9.7 464,400 11.0 173,700 5.8 110,900 7.3 466,900 12.8 353,500 13.1
Females 349,000 5.8 273,600 8.2 102,000 3.9 70,800 5.8 247,000 7.2 202,900 9.6
Persons 989,600 7.8 738,000 9.7 275,700 5.0 181,700 6.6 713,900 10.0 556,400 11.5
Colorectum Males 663,600 10.0 320,600 7.6 389,700 13.1 166,200 10.9 274,000 7.5 154,400 5.7
Females 570,100 9.4 288,100 8.6 337,700 13.1 153,900 12.6 232,400 6.7 134,100 6.3
Persons 1,233,700 9.7 608,700 8.0 727,400 13.1 320,100 11.6 506,400 7.1 288,500 6.0
Liver Males 522,400 7.9 478,300 11.3 81,700 2.7 75,400 4.9 440,700 12.1 402,900 14.9
Females 225,900 3.7 217,600 6.5 40,300 1.6 39,900 3.3 186,000 5.4 177,700 8.4
Persons 748,300 5.9 695,900 9.2 122,000 2.2 115,300 4.2 626,700 8.8 580,600 12.0
Lung Males 1,095,200 16.5 951,000 22.5 482,600 16.2 412,000 27.0 612,500 16.8 539,000 20.0
Females 513,600 8.5 427,400 12.8 241,700 9.4 188,400 15.4 272,000 7.9 239,000 11.3
Persons 1,608,800 12.7 1,378,400 18.2 724,300 13.0 600,400 21.8 884,500 12.4 778,000 16.1
Breast (F) 1,383,500 22.9 458,400 13.7 692,200 26.8 189,500 15.5 691,300 20.0 268,900 12.7
Cervix 529,800 8.8 275,100 8.2 76,500 3.0 32,900 2.7 453,300 13.1 242,000 11.4
Ovary 225,500 3.7 140,200 4.2 100,300 3.9 64,500 5.3 125,200 3.6 75,700 3.6
Prostate 903,500 13.6 258,400 6.1 648,400 21.8 136,500 8.9 255,000 7.0 121,900 4.5
Leukaemia Males 195,900 3.0 143,700 3.4 79,000 2.7 48,600 3.2 116,500 3.2 95,100 3.5
Females 155,000 2.6 113,800 3.4 61,700 2.4 38,700 3.2 93,400 2.7 75,100 3.5
Persons 350,900 2.8 257,500 3.4 140,700 2.5 87,300 3.2 209,900 3.0 170,200 3.5
Cancers included Males 4,021,200 60.7 2,616,400 61.9 1,855,100 62.4 949,600 62.1 2,165,600 59.3 1,666,800 61.8
in CONCORD-2 Females 3,952,400 65.5 2,194,200 65.6 1,652,400 63.9 778,600 63.7 2,300,600 66.6 1,415,400 66.7
study Persons 7,973,600 62.9 4,810,600 63.5 3,507,500 63.1 1,728,200 62.8 4,466,200 62.8 3,082,200 63.9
All cancers Males 6,629,100 100.0 4,225,700 100.0 2,975,200 100.0 1,528,200 100.0 3,654,000 100.0 2,697,500 100.0
except Females 6,038,400 100.0 3,345,800 100.0 2,584,800 100.0 1,223,200 100.0 3,453,600 100.0 2,122,600 100.0
skin Persons 12,667,500 100.0 7,571,500 100.0 5,560,000 100.0 2,751,400 100.0 7,107,600 100.0 4,820,100 100.0
Sources:
Jemal A, Bray F, Center MM, Ferlay J, Ward E, Forman D. Global cancer statistics. CA Cancer J Clin 2011; 61: 69-90
Ferlay J, Parkin DM, Curado MP, Bray F, Edwards BK, Shin HR, Forman D. Cancer incidence in five continents, volumes I to IX: IARC CancerBase No. 9. IARC, Lyon, 2010. http://ci5.iarc.fr
CANCER CONTROL 2013 63